Monitoring Kemp Loadmaster using SNMP and Prometheus
We have been running Kemp Loadmaster as our primary load balancer for over a year now. It’s a very decent yet relatively low cost solution which has directly replaced our IIS reverse proxy (ARR) solution we’ve had for years.
The one thing missing is a modern monitoring solution. We are using Prometheus and Grafana so we somehow need to export metrics from the Kemp Loadmaster instances into Prometheus and build dashboards in Grafana. We have 2 options here.
One way is to use the API and build an exporter which exposes an endpoint for Prometheus to pull from. Someone already tried this and shared the project on Github. Unfortunately the project hasn’t seen an update in 3 years and it doesn’t work anymore, probably due to changed in the Kemp Loadmaster API.
The other way is to use SNMP. The Prometheus project contains an SNMP exporter ready for use, so this might work. The exporter uses modules defined in the snmp.yml which is by default filled with modules for all kinds of appliances like Cisco, APC, Unifi etc. But no module for Kemp Loadmaster. We have to dive deeper to get the metrics we want.
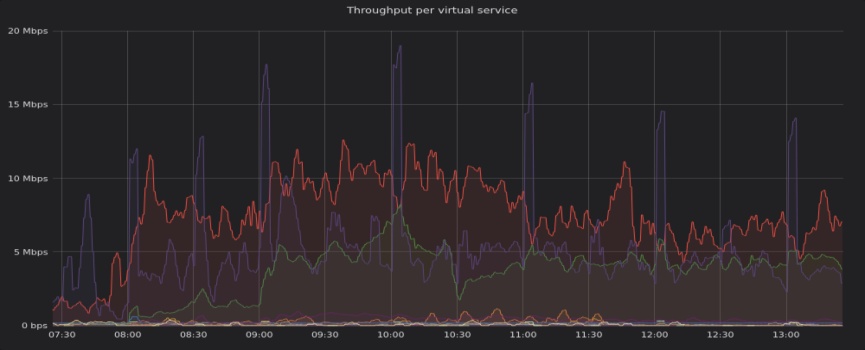
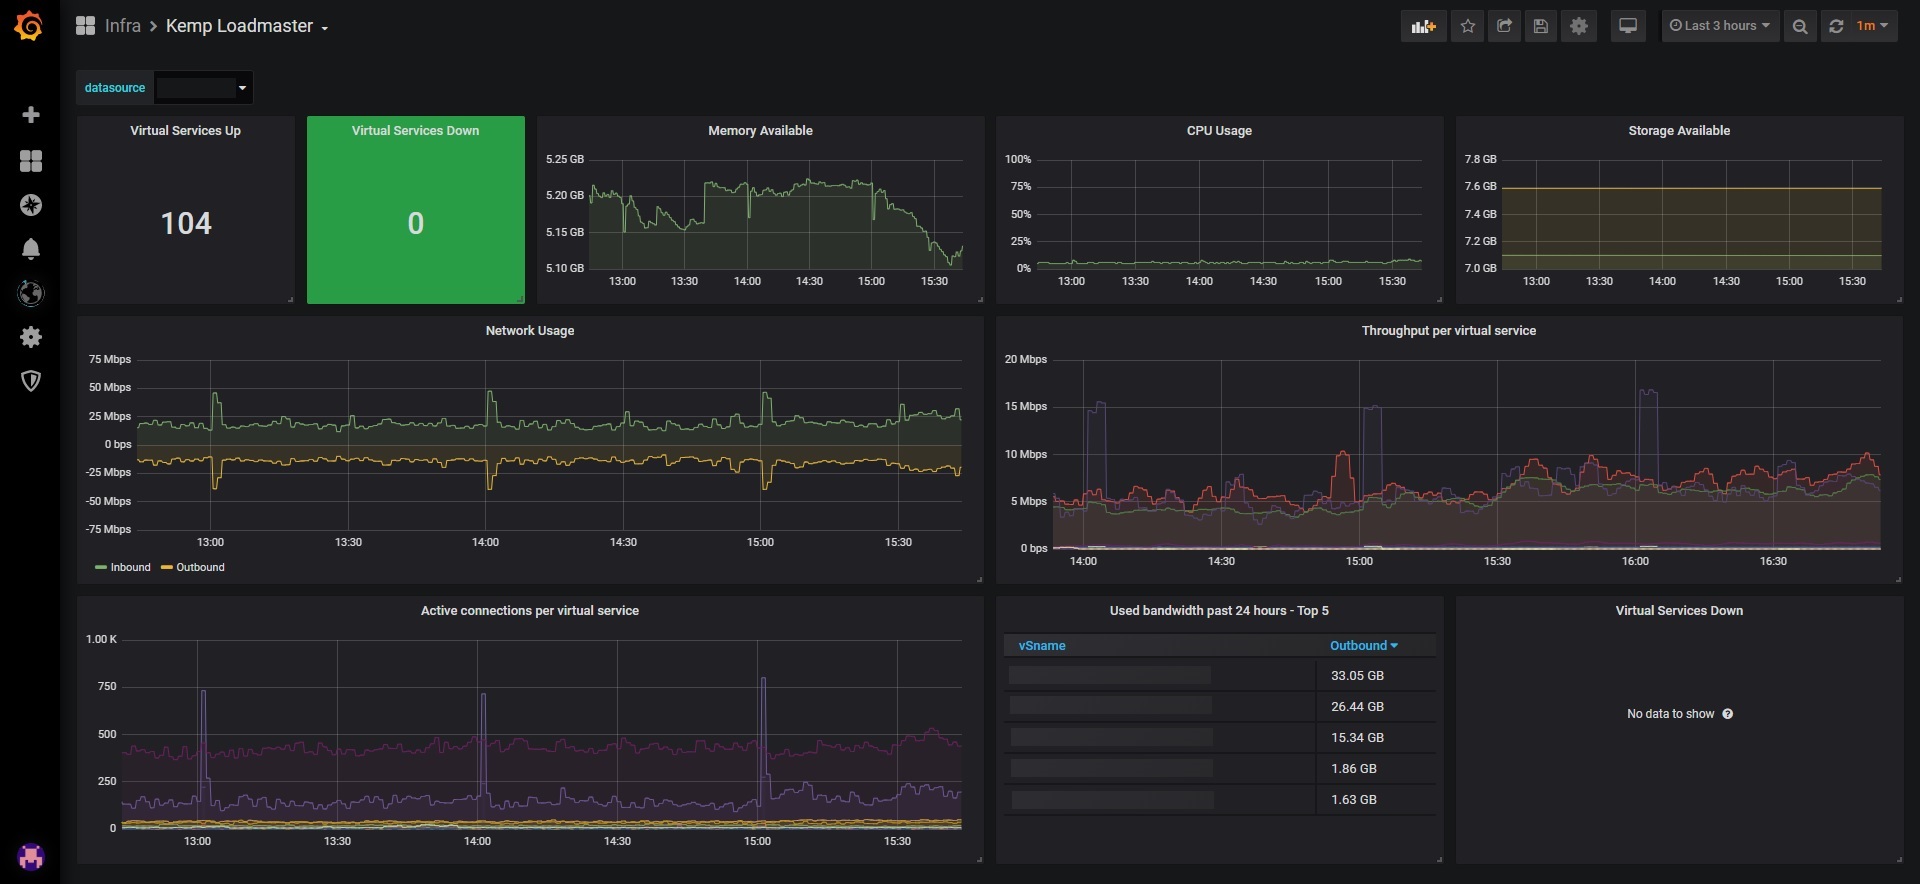
The SNMP exporter is able to generate custom modules using the MIB files provided by Kemp. I was able to generate a first version of the module which exports a bunch of metrics like active connections and network throughput. These metrics were then imported by Prometheus and could be queries by Grafana which resulted in a dashboard like this.
These are the steps I took to generate the snmp.yml and get the metrics in Prometheus.
See this Github Gist if you just want the snmp.yml.
Step 1: Generate Kemp Loadmaster module to use in snmp.yml
Run the following commands:
# Debian-based distributions.
sudo apt-get install unzip build-essential libsnmp-dev # Debian-based distros
# Redhat-based distributions.
sudo yum install gcc gcc-g++ make net-snmp net-snmp-utils net-snmp-libs net-snmp-devel # RHEL-based distros

go get github.com/prometheus/snmp_exporter/generator
cd ${GOPATH-$HOME/go}/src/github.com/prometheus/snmp_exporter/generator
go build
make mibs
Copy the Kemp Loadmaster mibs to the mibs directory
Add the following part to the generator.yml file.
modules:
  kemp_loadmaster:
    walk:
      - 1.3.6.1.4.1.12196.13.1 # vs
      - 1.3.6.1.4.1.12196.13.2 # rs
    lookups:
      - source_indexes: [vSidx]
        lookup: 1.3.6.1.4.1.12196.13.1.1.13 # vSName
    overrides:
      rSip:
        type: DisplayString
      vSip:
        type: DisplayString
      vSname:
        type: DisplayString
The following reads in from generator.yml and writes to snmp.yml.
export MIBDIRS=mibs
./generator generate
Your snmp.yml should now include a kemp_loadmaster module. This snmp.yml should be used to run the SNMP exporter.
Step 2: Test run SNMP exporter with the generated snmp.yml
If you use Docker you can just mount a volume to the folder where your snmp.yml is at.
version: "3.3"
services:
  snmp-exporter:
    image: prom/snmp-exporter:latest
    volumes:
      - ./snmp_exporter/:/etc/snmp_exporter/
    networks:
      - net
    ports:
      - 9116:9116
Once running the SNMP exporter should expose an endpoint at port 9116. You can test it by giving the ip address of hostname of the Kemp Loadmaster and the module in the url like this.
http://127.0.0.1:9116/snmp?target=192.168.1.20&module=kemp_loadmasterStep 3: Integrate SNMP exporter in Prometheus
After testing this you can include the SNMP exporter in your Prometheus stack and have it scrape data on a regular basis.
  - job_name: 'snmp-kemp-lb-module-exporters'
    scrape_interval: 1m
    scrape_timeout: 1m
    static_configs:
      - targets: ['192.168.1.20']
        labels:
          device: kemp-loadmaster
          environment: production
          site: datacenter
    metrics_path: /snmp
    params:
      module: [kemp_loadmaster] #which OID's we will be querying in
    relabel_configs:
      - source_labels: [__address__]
        target_label: __param_target
      - source_labels: [__param_target]
        target_label: instance
      - target_label: __address__
        replacement: snmp-exporter:9116  # The SNMP exporter's real hostname:port.
If you made it this far you deserve a little treat. Here is a link to my Grafana dashboard you can easily install.